TSA Prediction Market: Part 4 - Manual Trading

Today’s post
Introduction
Last time, we built a simple model to predict next week’s TSA traffic using only previous TSA traffic numbers. We relied on a straightforward heuristic: using last year’s numbers adjusted for YoY trend. This simple baseline model allows us to quickly get a model in production. From there, we can track performance and gradually refine it to improve profitability.
Today, we take the next step: using the output from this model to make actual trades on Kalshi, a prediction market platform where users can trade on the outcome of events. As a first step, we will send the model results as an email for manual trading.
Manual trading
I like to begin any automated trading strategy by doing some manual trading. This lets you pick up some intuition on how the market acts and can inform any automated trading strategies we may use. For example, in this TSA traffic market, we can show that TSA traffic is generally lower the first few days of the week. Do market participants pick up on this as well? or do they think of things more Year over Year and care more about the percentage change since last year to predict the final week’s traffic. Manually trading for a few weeks gives us the opportunity to pick out trends like this one.
Setting up our prediction system for manual trading will involve:
1. Set up AWS infrastructure to automate prediction notifications
2. Create process to scrape recent TSA data
3. Generate predictions for next week
4. Email results to make manual buy-sell decisions
By the end of this post, you’ll have a practical understanding of how to leverage your predictive model to potentially generate profits on Kalshi.
Note: I link to Kalshi with my referral link. We each get $25 if you sign up and make a certain number of trades with this link.
Architecture
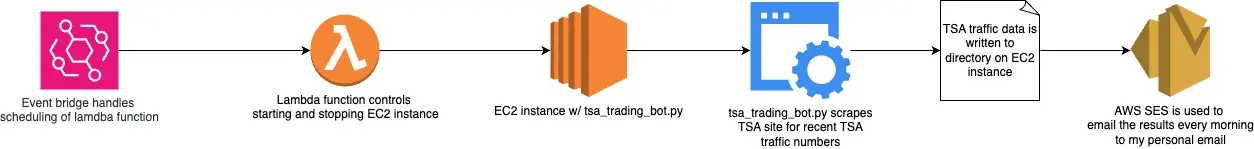
Our process will consist of the following components
1. Lambda function to turn on/off our EC2 instance
This step is just a money-saving task. Our EC2 instance costs money whenver it’s active. The purpose of this lambda function is to optimize the time when our EC2 instance is turned on. Since we only need our instance for <30 mins/day, it doesn’t make sense to pay for it to be on for 24 hours. Here is a good post on how to do this in depth
2. EventBridge handles scheduling of the Lambda function
Eventbridge lets us set up a schedule to kick off our lambda function at the same time every day.
3. EC2 instance is where the code is executed
EC2 is an AWS service to provide on-demand compute. This is where most of our work will take place.
4. Python scripts living on EC2 instance to scrape data and generate predictions
This is the python code we have been working on in the past few posts. We pull our git repo down to our EC2 instance and are able to execute this code within cron jobs at the specified intervals. This is how we scrape the TSA data daily and generate new predictions.
5. AWS SES allows us to send prediction results to email
We don’t want to log in to our EC2 instance every morning and check a file to see our most recent predictions. Instead, we simply use AWS SES to email us the results every morning. That way, we can just check our email to see what our algorithm expects for the next week.
Check out this post for how to schedule SES emails with Python
Python Code
Scrape recent TSA data
Previously, we created some code to scrape TSA traffic data, consolidate it into a single dataset, and save as a csv. Here, we want to take that code and set it up to run on a regular cadence on our EC2 instance.
import pandas as pd
import requests
import datetime
import logging
import time

def create_request_url(year_to_process, current_year):
    """Create Request URL

    Creates a URL for fetching TSA data based on the year to process and the current year.

    Args:
        year_to_process (int): The year for which the data is to be fetched.
        current_year (int): The current year.

    Returns:
        str: The URL for fetching TSA data for the specified year.
    """

    base_url = 'https://www.tsa.gov/travel/passenger-volumes'

    if year_to_process == current_year:
        url = base_url
    else:
        url = f"{base_url}/{year_to_process}"

    return url


def fetch_year_of_tsa_data(year_to_process):
    """Fetch TSA Data for a Specific Year

    Fetches TSA (Transportation Security Administration) data for a specific year from the TSA website.

    Args:
        base_url (str): The base URL of the TSA data website.
        year_to_process (int): The year for which the data is to be fetched.

    Returns:
        pandas.DataFrame: A DataFrame containing the TSA data for the specified year.
    """

    header = {'User-Agent': 'Mozilla/5.0'}  # TSA website blocks bot traffic unless you include this
    current_year = datetime.datetime.now().year

    url = create_request_url(year_to_process, current_year)

    logging.warning(f"Processing {year_to_process}")

    r = requests.get(url, headers=header)

    df = pd.read_html(r.text)[0]

    if year_to_process == current_year:
        df = df[['Date', str(current_year)]]
        df = df.rename(columns={str(current_year): "Numbers"})

    return df

def fetch_all_tsa_data():
    """Fetch All TSA Data

    Fetches TSA (Transportation Security Administration) data for all available years
    up to the current year and merges them into a single DataFrame.

    Returns:
        pandas.DataFrame: A DataFrame containing all the TSA data for the available years.
    """

    dfs = []

    for year_to_process in range(2019, datetime.datetime.now().year+1):

        df = fetch_year_of_tsa_data(year_to_process)

        dfs.append(df)

        time.sleep(1)  # Wait in between requests to avoid

    df_merged = pd.concat(dfs, ignore_index=True, sort=False)

    df_merged.to_csv("../data/tsa_data.csv")

    return df_merged

fetch_all_tsa_data()
To automate this process on our recently setup EC2 instance, I’m going to create the above code in a python script and kick it off every morning with a cron job.
This is an easy way to kick off this python script every day at the same time. This will write the TSA traffic data results to our EC2 instance in a directory that can be accessed for later use.
Generate predictions for next week’s TSA traffic
Now that we have the most TSA traffic data, we can generate next week’s predictions. We have already written this code in our previous post.
import pandas as pd
import datetime
import json
import logging

def lag_passengers():
    """
    Load TSA passenger data, process it to create lagged features, and return the processed dataframe.

    Steps:
    1. Load TSA data from a CSV file.
    2. Rename columns for clarity.
    3. Convert the date column to datetime format.
    4. Set the date column as the index and sort the index.
    5. Create a new column with passenger data from the previous year.
    6. Filter data to include only dates after June 1, 2022.
    7. Calculate a 7-day moving average of the number of passengers.
    8. Calculate a 7-day moving average of the previous year's passenger data.
    """
    # Load TSA data
    tsa_data = pd.read_csv("data/tsa_data.csv", index_col=0)

    # Rename columns for clarity
    tsa_data.rename(columns={"Date": "date", "Numbers": "passengers"}, inplace=True)

    # Convert date column to datetime format
    tsa_data['date'] = pd.to_datetime(tsa_data['date'], format='%m/%d/%Y')

    # Set the date column as the index and sort the index
    tsa_data = tsa_data.set_index('date')
    tsa_data.sort_index(inplace=True)

    # Create a new column with passenger data from the previous year
    tsa_data['previous_year'] = tsa_data['passengers'].shift(365)

    # Filter data to include only dates after June 1, 2022
    tsa_data = tsa_data[tsa_data.index > '2022-06-01']

    # Calculate a 7-day moving average of passengers
    tsa_data['passengers_7_day_moving_average'] = tsa_data['passengers'].rolling(window=7).mean()

    # Calculate a 7-day moving average of the previous year's passenger data
    tsa_data['passengers_7_day_moving_average_previous_year'] = tsa_data['previous_year'].rolling(window=7).mean()

    return tsa_data

def get_recent_trend(tsa_data):
    """
    Calculate recent trends in TSA passenger data and create predictions based on these trends.

    Steps:
    1. Calculate the current trend as the ratio of the 7-day moving average of passengers to the previous year's 7-day moving average.
    2. Create a lagged trend feature.
    3. Generate predictions using the previous year's 7-day moving average and the lagged trend.
    """
    # Calculate the current trend
    tsa_data['current_trend'] = tsa_data['passengers_7_day_moving_average'] / tsa_data[
        'passengers_7_day_moving_average_previous_year']

    # Create a lagged trend feature (Use 2 weeks ago in case data isn't available for previous week
    tsa_data['last_weeks_trend'] = tsa_data['current_trend'].shift(2)

    # Generate predictions using the previous year's 7-day moving average and the lagged trend
    tsa_data['prediction'] = tsa_data['passengers_7_day_moving_average_previous_year'] * tsa_data['last_weeks_trend']

    return tsa_data


def get_next_market_end():
    """
    The Kalshi market always ends on Sunday. This function will determine the date of the next Sunday
    and return the date in YYYY-MM-DD format.

    :return: str
    """
    today = datetime.date.today()
    # Calculate the number of days until the next Sunday (0 is Monday, 6 is Sunday)
    days_until_sunday = (6 - today.weekday()) % 7
    # If today is Sunday, we want the next Sunday, so we add 7 days
    if days_until_sunday == 0:
        days_until_sunday = 7
    next_sunday = today + datetime.timedelta(days=days_until_sunday)
    return next_sunday

def get_prediction(tsa_data):
    """
    Generate a prediction for the next Sunday's TSA passenger numbers based on historical data and recent trends.

    Steps:
    1. Determine the date of the next Sunday.
    2. Retrieve the number of passengers from the same Sunday last year.
    3. Calculate the year-over-year (YoY) adjustment based on recent trends.
    4. Multiply last year's passenger numbers by the YoY adjustment to get the prediction.

    :param tsa_data: DataFrame containing TSA passenger data with necessary features.
    :return: Dictionary with the date of the next Sunday as the key and the predicted number of passengers as the value.
    """
    next_sunday = get_next_market_end()
    last_year = (next_sunday - datetime.timedelta(days=365)).strftime("%Y-%m-%d")
    last_years_passengers = tsa_data.loc[last_year]['passengers_7_day_moving_average']
    logging.warning(last_years_passengers)
    three_days_ago = (datetime.date.today() - datetime.timedelta(days=4)).strftime("%Y-%m-%d")
    yoy_adjustment = tsa_data.loc[three_days_ago]['last_weeks_trend']
    logging.warning(yoy_adjustment)
    prediction = {}
    next_sunday = next_sunday.strftime("%Y-%m-%d")
    prediction[next_sunday] = {
        "last_year_passengers": last_years_passengers,
        "yoy_adjustment": yoy_adjustment,
        "prediction": last_years_passengers*yoy_adjustment
    }

    logging.warning(prediction)

    return prediction

def save_prediction(prediction):
    logging.warning(prediction)
    try:
        with open("data/tsa_traffic_predictions") as f:
            all_predictions = json.load(f)
        logging.warning(f"all predictions {all_predictions}")
        all_predictions.update(prediction)
        logging.warning(f"new prediction {prediction}")
        with open("data/tsa_traffic_predictions", "w") as outfile:
            json.dump(all_predictions, outfile)
    except FileNotFoundError:
        with open("data/tsa_traffic_predictions", "w") as outfile:
            json.dump(prediction, outfile)


def create_next_week_prediction():
    tsa_data = lag_passengers()
    tsa_data = get_recent_trend(tsa_data)
    prediction = get_prediction(tsa_data)
    save_prediction(prediction)

    return prediction
Email results
Finally, we need to send this final prediction to our personal email. This will make it easier to quickly consult the prediction and make our manual trades without requiring to log in to an EC2 instance first thing in the morning.
def send_email(body):
    SENDER = "ferraioloj@gmail.com"

    # Replace recipient@example.com with a "To" address. If your account
    # is still in the sandbox, this address must be verified.
    RECIPIENT = "ferraioloj@gmail.com"

    # The subject line for the email.
    SUBJECT = "Amazon SES Test (SDK for Python)"

    # The email body for recipients with non-HTML email clients.
    BODY_TEXT = body

    # The HTML body of the email.
    BODY_HTML = f"""<html>
    {body}
    </html>
                """

    # The character encoding for the email.
    CHARSET = "UTF-8"

    # Create a new SES resource and specify a region.
    client = boto3.client('ses')

    # Try to send the email.
    try:
        # Provide the contents of the email.
        response = client.send_email(
            Destination={
                'ToAddresses': [
                    RECIPIENT,
                ],
            },
            Message={
                'Body': {
                    'Html': {
                        'Charset': CHARSET,
                        'Data': BODY_HTML,
                    },
                    'Text': {
                        'Charset': CHARSET,
                        'Data': BODY_TEXT,
                    },
                },
                'Subject': {
                    'Charset': CHARSET,
                    'Data': SUBJECT,
                },
            },
            Source=SENDER
        )
    # Display an error if something goes wrong.
    except ClientError as e:
        print(e.response['Error']['Message'])
    else:
        print("Email sent! Message ID:"),
        print(response['MessageId'])
Conclusion
In today’s post, we should how to automate our simplified model process and send the results through email using common AWS services.
Over the next few weeks, I will use these results to place trades on the Kalshi platform with the hope of identifying opportunities to automate some trading rules.
The Series
Now, that the introduction is out of the way, let’s get started. Below are the different blog posts that are part of this series.
Please reach out if you have any feedback or want to chat.
-
Part 1: Web scraping to get historical data from the TSA site
-
Part 2: Finding supplementary data to help build our model (Note: I ended up not using this data in the model)