TSA Prediction Market: Part 2 - Supplementary Data

Overview
- Introduction
- Why do we need extra data?
- What are the determinants of traffic volumes?
- The data
- Combining everything
- Conclusion
- Next time
- Areas for improvement
- The Series
Introduction
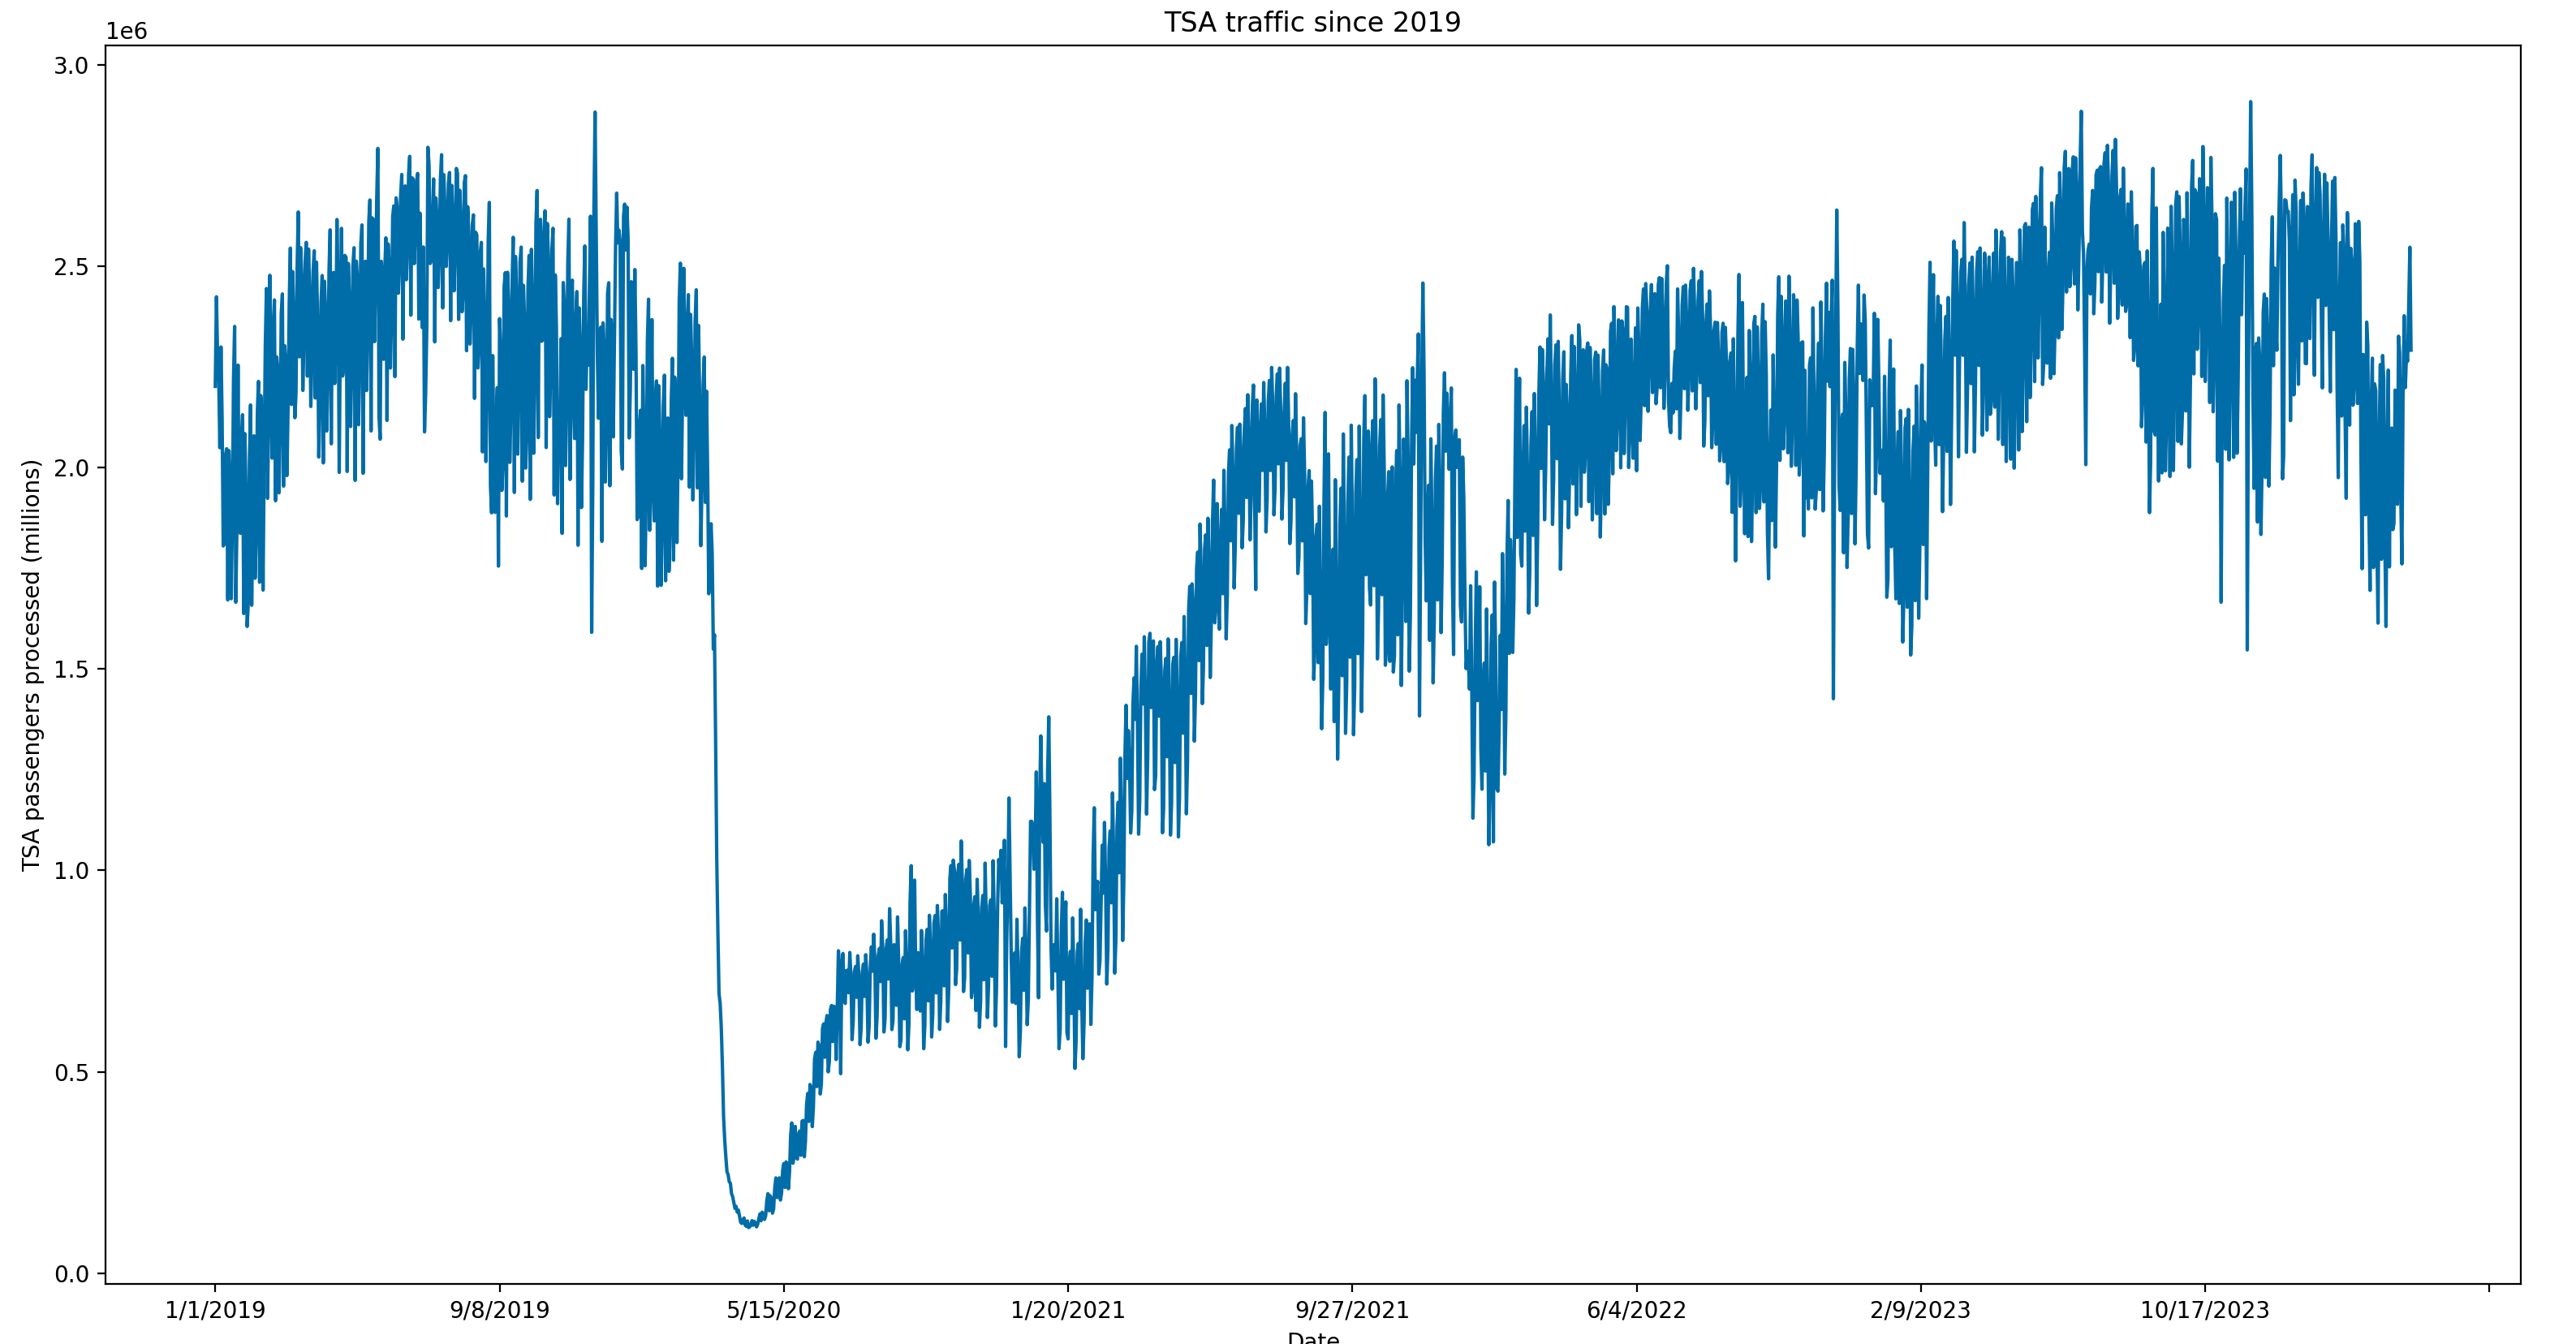
In this post, we’ll discuss the importance of supplementary data for our TSA traffic trading bot and how to extract it. Last time, we showed how to build a webscraper to get TSA traffic data for the past few years. But, we want to build the most accurate model possible, so we need more data to use in our model.
Why do we need extra data?
But first, we need to talk about why we need any additional data at all. We already have the most recent TSA traffic data. If the recent data is trending ~5% above the same time period last year, can we just assume the next couple of days will be similar?
This, by itself, could actually be a useful model. However, it is entirely backwards looking and just because yesterday’s traffic is a certain amount above baseline does not mean tomorrow’s traffic will be a similar amount. And, any extra edge we can get to predict tomorrow’s numbers will improve our chance of profitability.
What are the determinants of traffic volumes?
So, to gain an edge above the previous day’s TSA traffic, we would benefit from information that isn’t already captured by yesterday’s TSA traffic data.
Forward-looking data is really what we are missing. So, we want data points that indicate consumers are about to travel in the next few days.
We could look for indicators of interest in purchasing flights, but customers normally book further in advance than a few days. So, we need data points with less of a lag.
We also want to flag any special days coming up soon – especially if these special days occur on a different calendar day year-to-year (e.g. Easter).
The data
Google trends
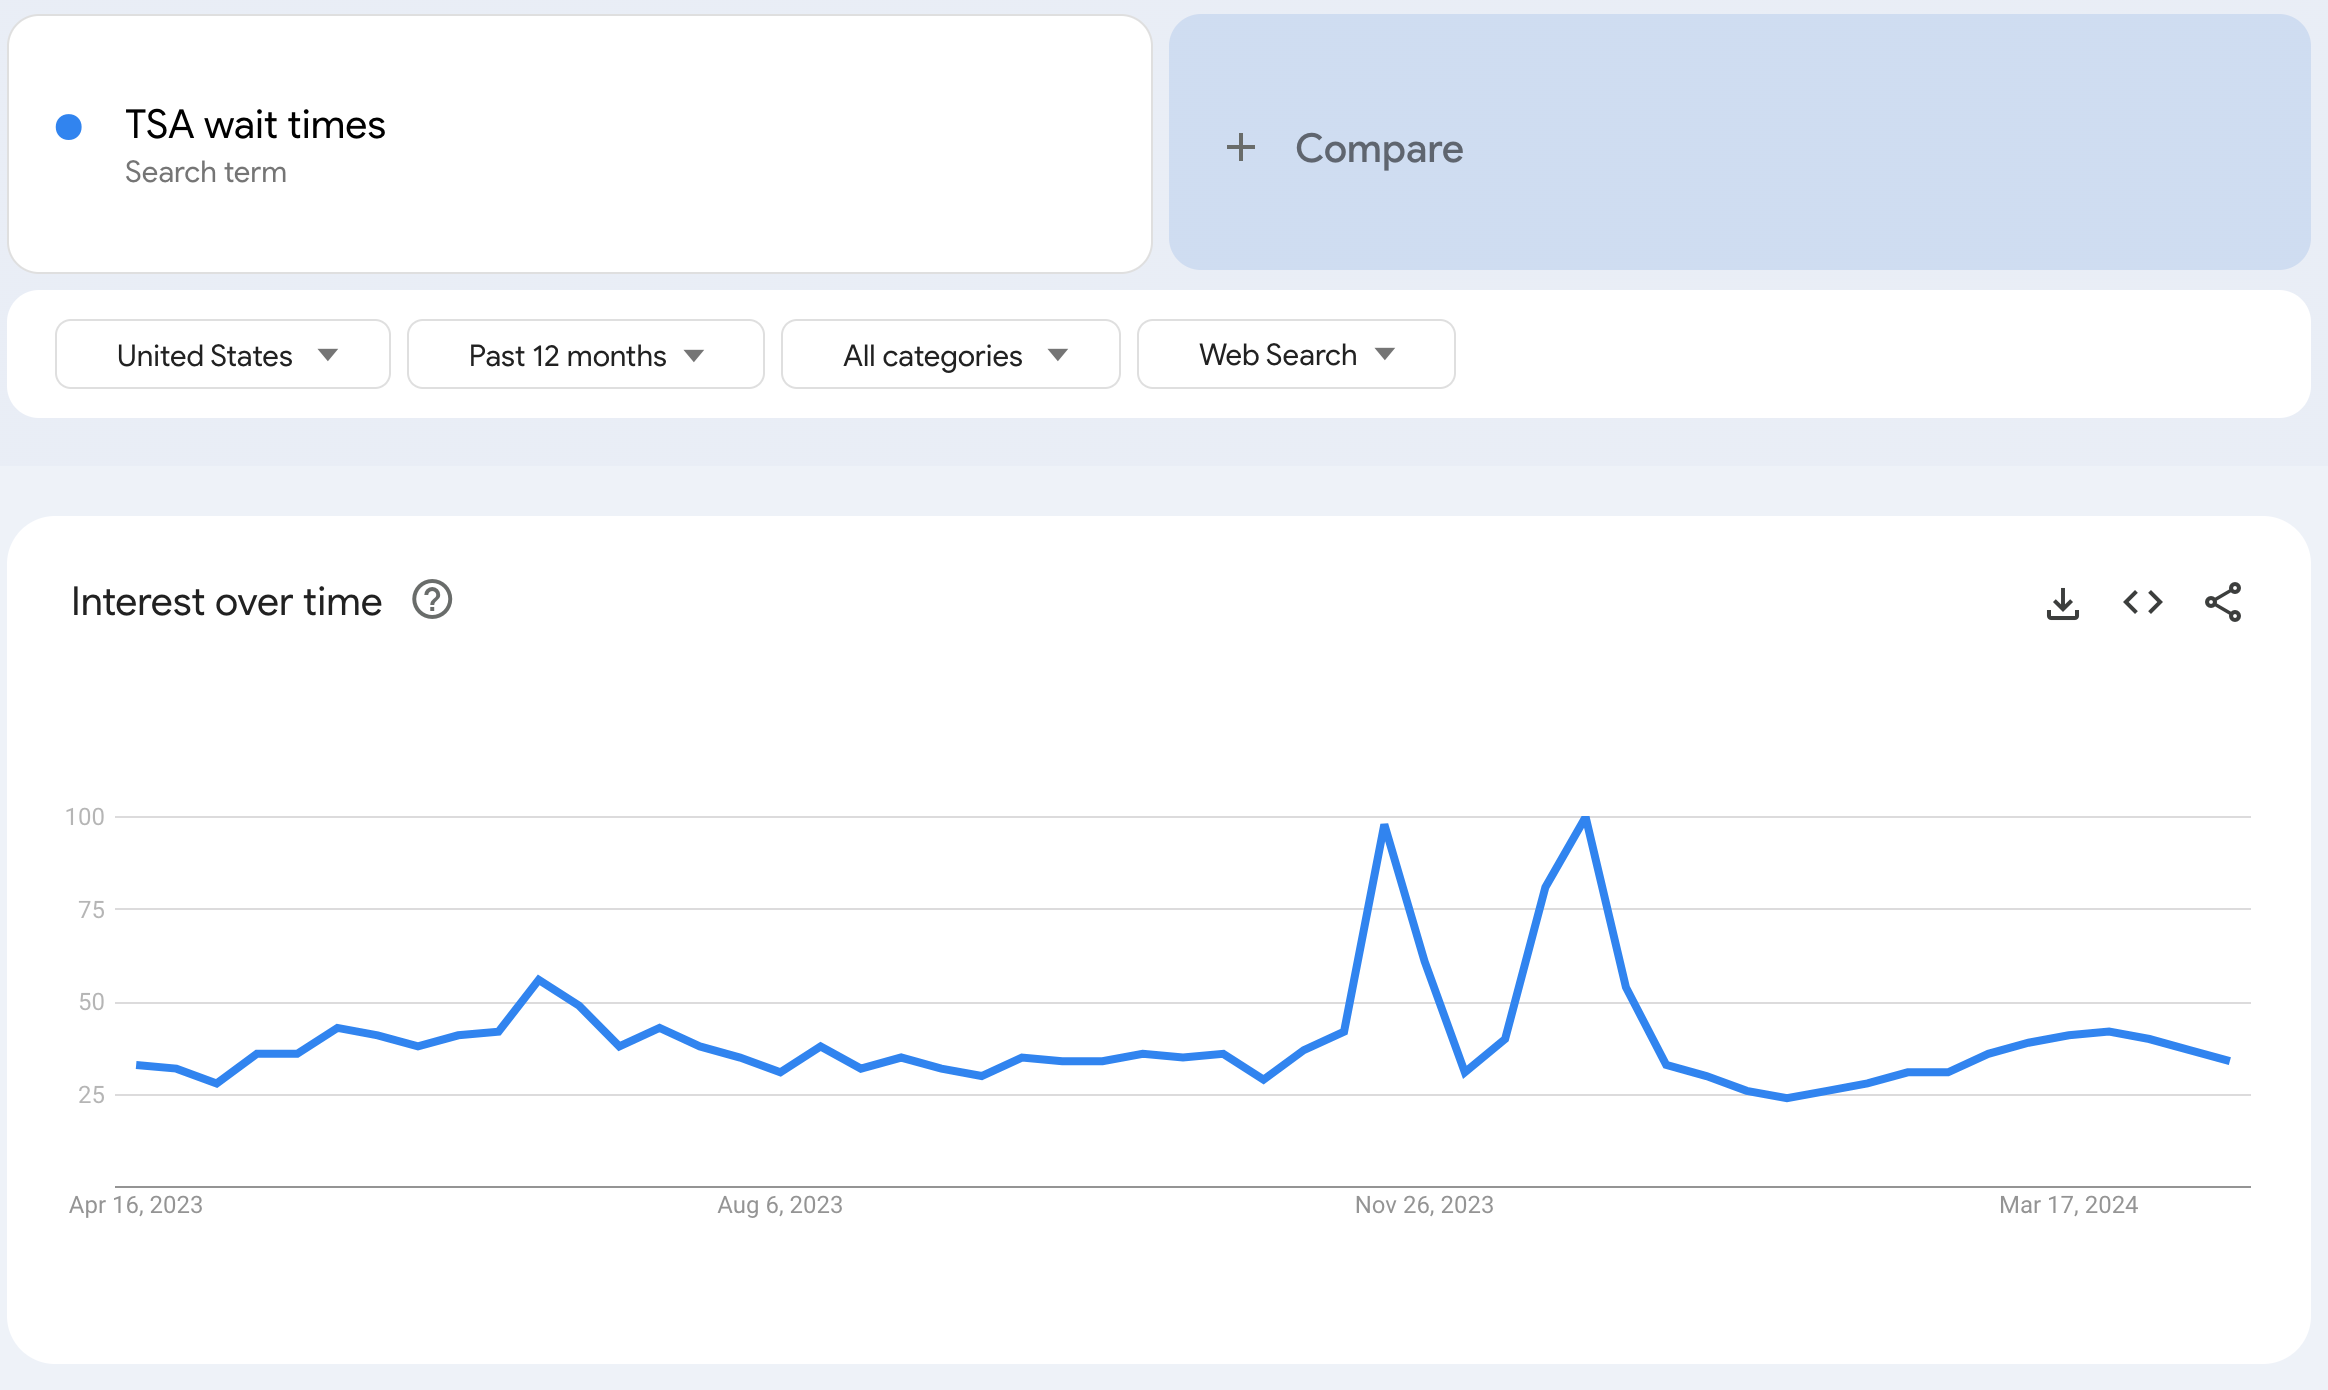
Google trends shows search results for specified keywords. We can use Google Trends to search for keywords indicating consumers will be traveling in the next few days. Any search term about airline, TSA, or travel processes could be used here. Below is an example showing the past 12 months of Google Trends data for the search term “TSA wait times”. We can see large spikes around the end of November and end of December corresponding with Thanksgiving and Christmas travel respectively.
We will be using the Pytrends package to connect to Google Trends and pull the data.
Below we create a function called get_single_google_keyword() that takes a single
keyword at a time and returns search trend results for the past year. We are unable
to request data for a longer period of time. Google trends supports querying multiple
keywords at the same time, but this will return results relative to one another instead
of just a single keyword where the search interest metric is relative to itself over time.
def get_single_google_keyword(keyword):
    """
    Fetches Google Trends data for a single keyword.

    Args:
        keyword (str): The keyword to fetch data for.

    Returns:
        DataFrame: A pandas DataFrame containing the Google Trends data for the keyword.
    """
    logging.info(f"Getting google trends data for keyword: {keyword}")
    pytrends = TrendReq(hl='en-US', tz=360)
    kw_list = [keyword]
    pytrends.build_payload(kw_list, cat=0, timeframe='today 12-m')
    data = pytrends.interest_over_time()
    logging.info(f"Finished getting Google Trends data for : {keyword}")

    return data
Now, we can iterate through our list of keywords and extract Google Trends data for each one.
Here we define a list of keywords that we want search results for. Then, we iterate
through this list calling get_single_google_keyword() for each keyword. Then, we
use functools.reduce() to merge all of these dataframes together. This is the same
thing as calling merge multiple individual times for all the dataframes we want combined
but is cleaner.
def get_google_trends_data():
    """
    Fetches Google Trends data for a list of keywords and combines them into a single DataFrame.

    Returns:
        DataFrame: A pandas DataFrame containing the combined Google Trends data for the keywords.
    """

    keywords = [
        "TSA wait times",
        "Airport security",
        "Airline checkin"
    ]
    dfs = []
    for keyword in keywords:
        data = get_single_google_keyword(keyword)
        data = data.reset_index()
        dfs.append(data)

    df_final = ft.reduce(lambda left, right: pd.merge(left, right), dfs)

    df = df_final.astype({"date": "datetime64[ns]"})

    df_final.to_csv("../data/google_trends.csv")

    return df_final
Great! Now we are done with our Google Trends data. We can move on to our next data source.
Holidays
Next, we want to capture details about holidays. Holidays can significantly skew traffic for days leading up to and surrounding a holiday. Luckily, there is a Python package called holidays that has all major holidays compiled.
In the below code, we use the holidays package to get the holidays since 2019. Then, we one hot encode the holidays. One hot encoding is a way to pivot string values into separate columns and marking each one as either true or false. So, in our case, we have 17 different holidays. Instead of storing them in one column, we have 17 different columns – one for each different holiday. This means there will be a column for Christmas day that is True only on December 25th.
For example, we may start with a dataset like this. Machine learning models work best with numerical data, so we need to figure out a way to convert this dataset into a numerical representation.
| Date | Holiday |
|---|---|
| 2019-01-01 | New Year’s Day |
| 2019-05-27 | Memorial Day |
| 2019-07-04 | Independence Day |
| 2019-09-02 | Labor Day |
| 2019-11-11 | Veterans Day |
At first, you might be tempted to set a 1 or 0 based on whether there is a holiday on a given day. This could be used, but it treats all holidays as the same. Which, from a travel standpoint, is not true at all. So, we use the one hot encoding to get it in the following format. Now each holiday is treated as a distinct event. The main problem with this approach is that holidays don’t happen very often, so we may not have enough instances of a specific holiday’s impact on travel to give us enough signal.
| date | Christmas Day | Christmas Day (observed) | Columbus Day | Independence Day |
|---|---|---|---|---|
| 2019-01-01 | False | False | False | False |
| 2019-05-27 | False | False | False | False |
| 2019-07-04 | False | False | False | True |
| 2019-09-02 | False | False | False | False |
| 2019-11-11 | False | False | False | False |
def get_holiday_data():
    """
    Extracts US holiday data for the years 2019 to 2024 and saves it to a CSV file.

    Returns:
        DataFrame: A pandas DataFrame containing the US holiday data with one-hot encoding for holidays.
    """
    logging.warning("Extracting holiday data...")
    years = [x for x in range(2019,2025)]
    us_holidays = holidays.US(years=years)

    data = [[date, holiday_name] for date, holiday_name in us_holidays.items()]

    df = pd.DataFrame(data, columns=['date', 'holiday'])
    one_hot = pd.get_dummies(df["holiday"])
    df = df.drop("holiday", axis=1)
    df = df.join(one_hot)

    df = df.astype({"date": "datetime64[ns]"})

    df.to_csv("../data/holiday_data.csv")

    logging.warning("Holiday data extracted and results written to csv")

    return df
Weekly economic indicator
Finally, we will leverage the Weekly Economic Index from the Federal Reserve Bank of Dallas:
The Weekly Economic Index (WEI) provides a signal of the state of the U.S. economy based on data available at a daily or weekly frequency. It represents the common component of 10 different daily and weekly series covering consumer behavior, the labor market and production.
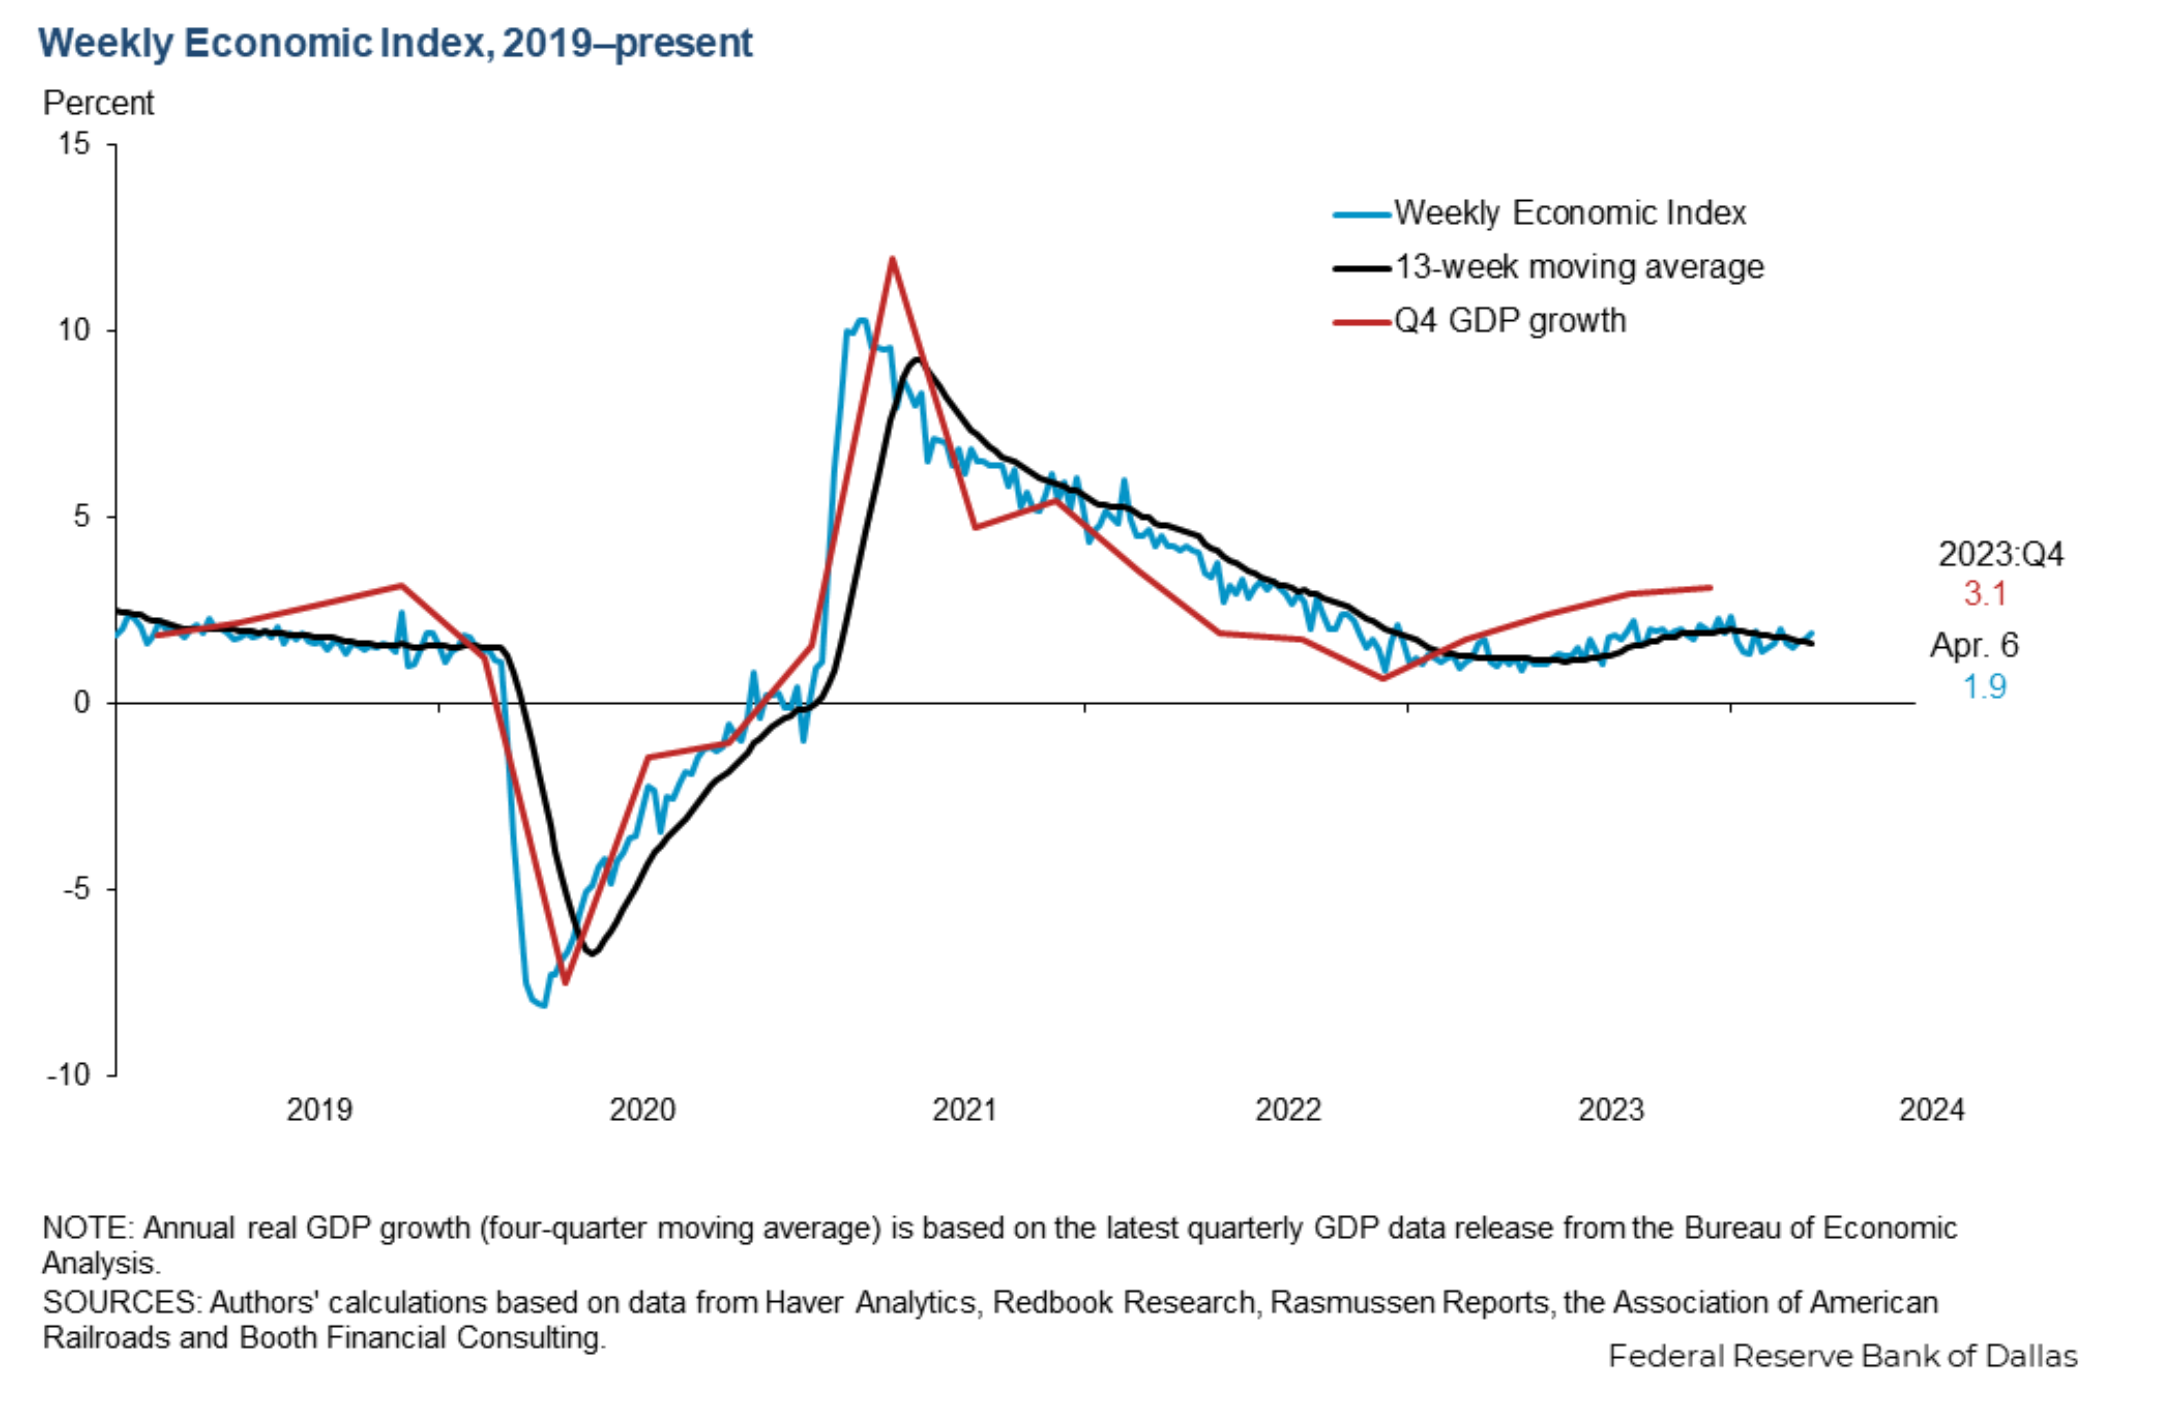
This reflects general macro trends at any given time. There seems to be little variation month to month and most variation over a longer timeframe.
The thinking here is that greater economic activity will lead to more air travel. The Federal Reserve Bank of Dallas provides access to this data on their website in a .xlsx file. Below we define a function to retrieve this data. With pandas, we can read the data directly from the url, then we clean the data to match the format of the other data sources, and finally, we take only the most recent years.
def get_weekly_economic_indicator_data():
    """
    Extracts weekly economic indicator data from the Dallas Fed website and saves it to a CSV file.

    Returns:
        DataFrame: A pandas DataFrame containing the weekly economic indicator data.
    """
    logging.warning("Extracting weekly economic indicator data...")
    df = pd.read_excel(
        "https://www.dallasfed.org/-/media/documents/research/wei/weekly-economic-index.xlsx",
        sheet_name="2008-current"
    )

    df = df[["Date", "WEI"]]

    df = df.rename(columns={"Date": "date"})

    df= df.astype({"date": "datetime64[ns]"})

    df = df[df['date'] > "2019-01-01"]

    df.to_csv("../data/wei_data.csv")

    return df
Combining everything
Now that we have code to fetch our data sources, we want to combine them together to create a single dataset by date that has our different features. First, we want to make sure that every date is represented in our dataset. For this, we will create a date dimension dataframe. This will serve as the “base” of our data that we join the other data sources on.
def create_date_table(start='2019-01-01', end=datetime.date.today().strftime("%Y-%m-%d")):
    """
    Creates a date table containing date-related information from a given start date to an end date.

    Taken from: https://stackoverflow.com/questions/47150709/how-to-create-a-calendar-table-date-dimension-in-pandas

    Args:
        start (str): The start date for the date table in the format 'YYYY-MM-DD'. Default is '2019-01-01'.
        end (str): The end date for the date table in the format 'YYYY-MM-DD'. Default is today's date.

    Returns:
        DataFrame: A pandas DataFrame containing the date table with columns for date, day of the week, week number, quarter, year, and year half.
    """
    df = pd.DataFrame({"date": pd.date_range(start, end)})
    df["Day"] = df.date.dt.day_name()
    df["Week"] = df.date.dt.strftime("%U")
    df["Quarter"] = df.date.dt.quarter
    df["Year"] = df.date.dt.year
    df["Year_half"] = (df.Quarter + 1) // 2
    return df
Now we call each of the above defined functions, add the data to a list of dataframes, and join the individual dataframes
together to get a single dataframe on a date granularity containing all features. Since, some of our data is updated
weekly, we use ffill() to apply the value of the most recently populated date to future dates. We save it as a csv
for later use.
def get_supplementary_data():
    """
    Retrieves and combines supplementary data including date table, Google Trends data, holiday data, and weekly economic indicator data.

    Returns:
        bool: True if the data retrieval and combination are successful.
    """
    all_data = []
    all_data.append(create_date_table())
    all_data.append(get_google_trends_data())
    all_data.append(get_holiday_data())
    all_data.append(get_weekly_economic_indicator_data())

    all_data_df = ft.reduce(lambda left, right: pd.merge(left, right, on="date", how="outer"), all_data)

    all_data_df = final_data_cleanup(all_data_df)

    all_data_df.to_csv("../data/all_supplementary_data.csv")

    return True
Conclusion
This concludes our extraction of supplementary data. In today’s post, we discussed the need for additional data in our model and outlined what type of data we were looking for. Then, we identified three different sources of data and showed how to use Python to programmatically extract the data.
Next time
In the next post, we will start to do some exploratory analysis of the data and determine the best type of model for out trading bot. Then, we will begin the modeling process and set up an MVP model. Subsequent posts will explore how to evaluate this kind of model, how to fine-tune it, and how to set up the infrastructure to actually generate inferences and automate trading on those predictions.
Areas for improvement
This is by no means the best possible model. We could spend more time to implement the following:
Extract different data sources
We have a pretty limited amount of data in this post. There is definitely more data that could be used and possibly improve the performance of our eventual trading bot.
One example is weather data. Weather seems like it would be a big driver of travel volume, but this presents unique challenges since there is not a single weather metric across the entire country. You would likely need to get weather data for many cities and figure out a way to distill that into just a few features.
Data quality checks, error handling, and logging
Similar to last time, we did not implement data quality checks, error handling, or extensive logging in our code. These would all increase the robustness of our project and make it easier to debug when issues inevitably arise.
The Series
Now, that the introduction is out of the way, let’s get started. Below are the different blog posts that are part of this series.
Please reach out if you have any feedback or want to chat.
-
Part 1: Web scraping to get historical data from the TSA site
-
Part 2: Finding supplementary data to help build our model (Note: I ended up not using this data in the model)